How to read a borehole log: SPT, RQD and core recovery
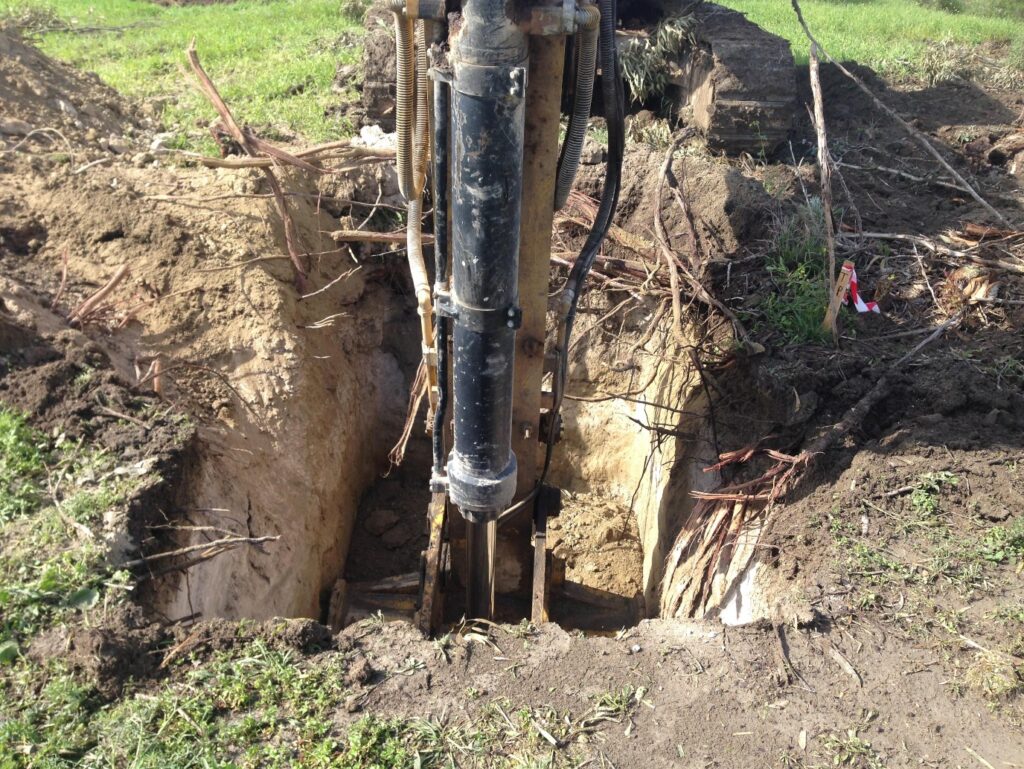
A borehole log is the core record of a geotechnical drilling job: the layers met with depth and their descriptions, sample depths, SPT results, core recovery and RQD in rock, and groundwater observations. This guide explains how to read entries such as N = 32, 50/80 mm or RQD 45%, and where they can mislead. It is written for consultants, reviewers and owners who receive logs, for example from our geotechnical drilling work. Foundation design remains the project engineer’s decision.
What a borehole log shows
A complete log contains:
- Header: borehole number, location and ground level, drilling method, borehole and core diameters, casing depth and flushing medium.
- Depth scale and layer boundaries, with a symbol for each material. A dashed boundary is usually inferred, not observed.
- Descriptions: soils to TS EN ISO 14688-1, classified to TS EN ISO 14688-2:2018; rock to TS EN ISO 14689, the Turkish adoption of EN ISO 14689:2018. A soil entry reads like “stiff, light brown, slightly sandy CLAY”; a rock entry gives strength, weathering, colour, structure and a name such as MARL.
- Samples: type and depth (SPT, disturbed, tube or core). TS EN ISO 22475-1 sets out the sampling methods and categories; the category decides which laboratory tests a sample can serve.
- SPT records and core runs with their TCR, SCR and RQD.
- Groundwater strikes and readings, and remarks such as water losses, cavities or obstructions.
The SPT: how the N value is measured
The standard penetration test (SPT) is carried out to TS EN ISO 22476-3:2013 and its amendment TS EN ISO 22476-3/A1:2013; ASTM D1586/D1586M-18e1 is the American equivalent. A 63.5 kg hammer falls freely through 760 mm and drives a split-barrel sampler into the base of the hole:
- Seating drive: the first 150 mm, in soil disturbed by drilling; its blows are recorded but not counted.
- Test drive: the next 300 mm; N is the number of blows for them. Blows of 4, 6 / 7, 8, 9, 8 per 75 mm give N = 7 + 8 + 9 + 8 = 32.
- Refusal: the test drive may stop at 50 blows (100 in soft rock), and the log gives blows over penetration: 50/80 mm is 50 blows for 80 mm.
The split-barrel sample is disturbed: fine for description and index tests (water content, grading, Atterberg limits), not for strength or compressibility.
Corrected values: N60 and (N1)60
Rigs deliver different energy to the rods. TS EN ISO 22476-3 therefore uses the energy ratio Er, the measured energy as a percentage of the theoretical free-fall energy, requires it to be known when N is used quantitatively, and gives corrections in its informative Annex A:
- N60 = N × Er / 60, which makes results from different rigs comparable.
- Rod length: energy is lost on short rod strings, so shallow tests may be adjusted.
- (N1)60: in sands only, N60 normalised to a vertical effective stress of 100 kPa, to compare sands at different depths.
The log should always show the measured N. Corrected values belong in the engineer’s interpretation, with Er and the method stated; if a report gives only corrected values, ask for the field blow counts.
What N tells you, and where it misleads
N is an index, not a soil parameter. The terms below come from Skempton (1986, Géotechnique 36(3), 425–447) for sand and from Terzaghi and Peck (Soil Mechanics in Engineering Practice, 2nd ed., 1967) for clay, not from TS EN ISO 22476-3. They are a first indication only; in clay the SPT is coarse, and the description and laboratory tests are a better guide.
| (N1)60 in sand | Relative density | N in clay | Consistency |
|---|---|---|---|
| 0–3 | Very loose | < 2 | Very soft |
| 3–8 | Loose | 2–4 | Soft |
| 8–25 | Medium dense | 4–8 | Medium |
| 25–42 | Dense | 8–15 | Stiff |
| 42–58 | Very dense | 15–30 | Very stiff |
| > 30 | Hard |
Common traps:
- Gravel and cobbles: one stone in front of the sampler can raise N sharply.
- Cemented bands and calcrete crusts can give refusal above weaker material.
- Weak rock and marl: soil correlations do not apply, and dry marl can look and drill like rock (see our guide to ground in Cyprus).
- Below the water table: water flowing into the hole loosens sand at its base and lowers N, unless the water level in the hole is kept above groundwater.
- Refusal is not proof of rock: a boulder or dense gravel gives the same record. Rock is confirmed by coring a set length into it.
Rock cores: TCR, SCR and RQD
In rock, the hole is advanced by rotary core drilling. Each run is boxed, photographed and logged with three indices described in TS EN ISO 14689:
| Index | What is measured | Expressed as |
|---|---|---|
| TCR (total core recovery) | All core recovered, whatever its condition | % of run length |
| SCR (solid core recovery) | Core pieces with a full circumference | % of run length |
| RQD (rock quality designation) | Sound pieces at least 100 mm long, measured along the core axis | % of run length |
Deere (1964, Rock Mechanics and Engineering Geology 1(1), 16–22) introduced RQD with the familiar terms 0–25% very poor, 25–50% poor, 50–75% fair, 75–90% good and 90–100% excellent; Deere and Deere (1988, ASTM STP 984) reviewed its use. ASTM D6032/D6032M-17, which notes that RQD was developed for 54.7 mm N-size core, has since been withdrawn without a replacement, so TS EN ISO 14689 is the reference. Points to watch:
- Breaks caused by drilling or handling are fitted together and not counted.
- RQD is not strength: a weak but massive marl can score close to 100%, a strong but jointed limestone very low.
- Low recovery in marl and calcarenite can reflect the drilling (barrel, bit, flushing, rate of advance) as much as the rock; photographs and the driller’s notes help to tell lost core from a soft zone.
- Some marls crack as they dry, so RQD is logged when the core comes out, not after weeks in storage.
Groundwater on the log
A good log separates:
- The water strike, where water first entered the hole, and whether it then rose.
- The level after a rest period, for example before drilling resumes the next morning; flushing water can mask the true level.
- Long-term levels, which need a standpipe or piezometer read over time.
In Cyprus, groundwater and perched water above clay can change markedly between the wet winter and the dry summer, so “no water encountered” describes the borehole during drilling, not the site all year round.
From logs to a ground model
Each borehole is one vertical line through the ground. Boreholes, test pits and DCP tests to ASTM D6951/D6951M-18(2023) are combined into a ground model with cross-sections. Boundaries between points are interpretation; where the ground changes over short distances, add points rather than interpolate between distant boreholes.
Ask the author of a log:
- Which standard editions were used, and what is the energy ratio of the SPT hammer?
- Are the N values raw or corrected?
- Which core barrel and core size were used, and when was RQD logged?
- When were groundwater levels read, and which samples were tested?
A log alone cannot give a layer’s strength, compressibility or swelling potential, the ground between boreholes or long-term water levels; those need laboratory tests, more points and monitoring. To check that a report is genuine, see our guide on how to read and verify a test report.
How we can help
We drill rotary core and sampling boreholes, carry out the SPT to TS EN ISO 22476-3, box and photograph the cores, record TCR, SCR and RQD, and observe groundwater. Our laboratory tests the samples, for example for water content (TS EN ISO 17892-1:2014+A1:2022), particle size distribution (TS EN ISO 17892-4:2016) and Atterberg limits (TS EN ISO 17892-12:2018+A2:2022). See our geotechnical drilling, site investigation and DCP testing and soil laboratory testing pages, or send us your site plan and project details through our contact page.
Frequently asked questions
Why is core recovery often low in marl?
Weak, clayey or fractured zones can be washed out or broken up, and the drilling method matters a great deal. Low recovery is a reason to check the photographs and drilling notes; on its own it proves neither a void nor a soft layer.
Can the bearing capacity be read directly from N?
No. The designer combines N with the layer profile, laboratory results, groundwater and foundation geometry, and uses correlations only within their limits; that judgement belongs to the project’s geotechnical or structural engineer.
What does an RQD of 0% mean?
No sound piece of 100 mm or more was recovered in that run. That can mean heavily fractured rock, a weak material that broke up in drilling, or a soil-like zone. Read it with TCR, the description and the photographs.